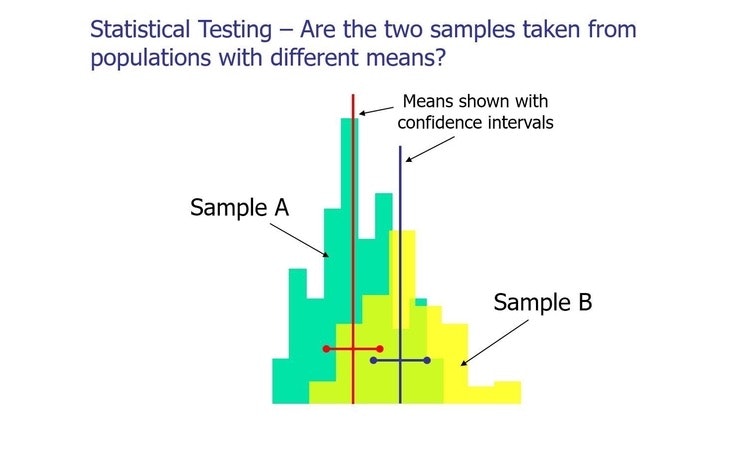
Most scientists and engineers quote a Standard Deviation when they measure a mean value, despite the fact that they will go on to compare their mean with another mean (or standard value). Examining the Standard Deviations of the samples helps you to understand how much variability you are seeing but can’t give you any confidence in whether or not the means are significantly different from each other – which is often what you are after.
On the other hand, tests for statistical differences are based on SEs, so plotting these as error bars gives a visual indication of whether or not the means are significantly different.
If you don’t get the point then maybe you should attend one of our Fundamentals courses?


