Live – The How and Why of Preference Mapping for Product Optimisation – 22nd April 2026
Product code: Prefmap-26

Online training

April 22, 2026 - April 22, 2026

Virtual option available
26th April 2026 1330-1630 (GMT+1) (including 30 min break halfway)
Half day online training workshop using case studies to bring the techniques alive and enable you to know how to apply them to your own data, using our easy to use App LovR (Liking Optimisation viewer in R) and XLSTAT. Preference mapping covers a group of techniques to link consumer liking data to quantitative product characteristics often, but not necessarily, sensory panel data.
What you will learn:
By attending the online session, you will learn when to use preference mapping, how the modelling works and most importantly how to interpret the maps and use them to characterise ideal products within the product space investigated.
There will be plenty of opportunity for discussion during the session and email support for 2 weeks following the session. As well as the live lectures and discussions with Anne you will receive workshops in XLSTAT with annotated solutions – great for future reference!
Motivation
- Linking consumer response (usually but not necessarily -liking) to product characterisation to understand product acceptability better
- Limitations of Drivers of liking (Correlation/ Partial Least Squares) as linear methods
External Preference Mapping 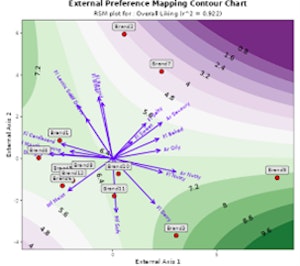
- Overview of how it works
- Case Studies illustrated using the easy to use LovR App written and maintained by Qi Statistics
- Interpretation of maps , estimating the ideal product
- Different mapping metrics – sensory panel data/Check all that Apply (CATA) from consumers/ Ingredient data
- Different response metrics – Liking/ Top box %/Functional Scores
- XLSTAT PREFMAP overview (with an annotated workshop and solutions for you to run in your own time)
Other Preference Mapping Methods 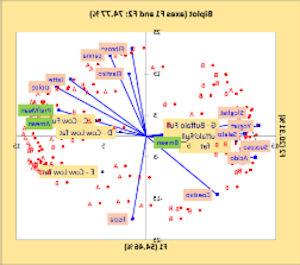
- Internal Preference Mapping for a quick visualisation of consumer variation and grouping of products by liking
- Mapping using text data
- Structured products using DOE (Design of Experiments)
The fee includes access to the Qi Statistics LovR App, there will be optional annotated workshops provided using XLSTAT
Pre-requisite: familiarity with correlation, variance and covariance (available in module C2), familiarity with regression and reading principal component analysis (PCA) maps.
Software used: Qi LovR app (see below) and XLSTAT
Select currency
$647.36 – $719.29 (Excluding any applicable taxes)